ExaViewer v1.0

Network Analysis That
Actually Makes Sense

You don't need to memorize TCP flags. You just need to click on the red things. Multi-user, remote-first, petabyte-scale packet analysis with web and terminal interfaces.

ExaViewer analysis view showing Zeus Bot detection with inline IDS alerts, flow markers, bookmarks, and protocol-colored packet list

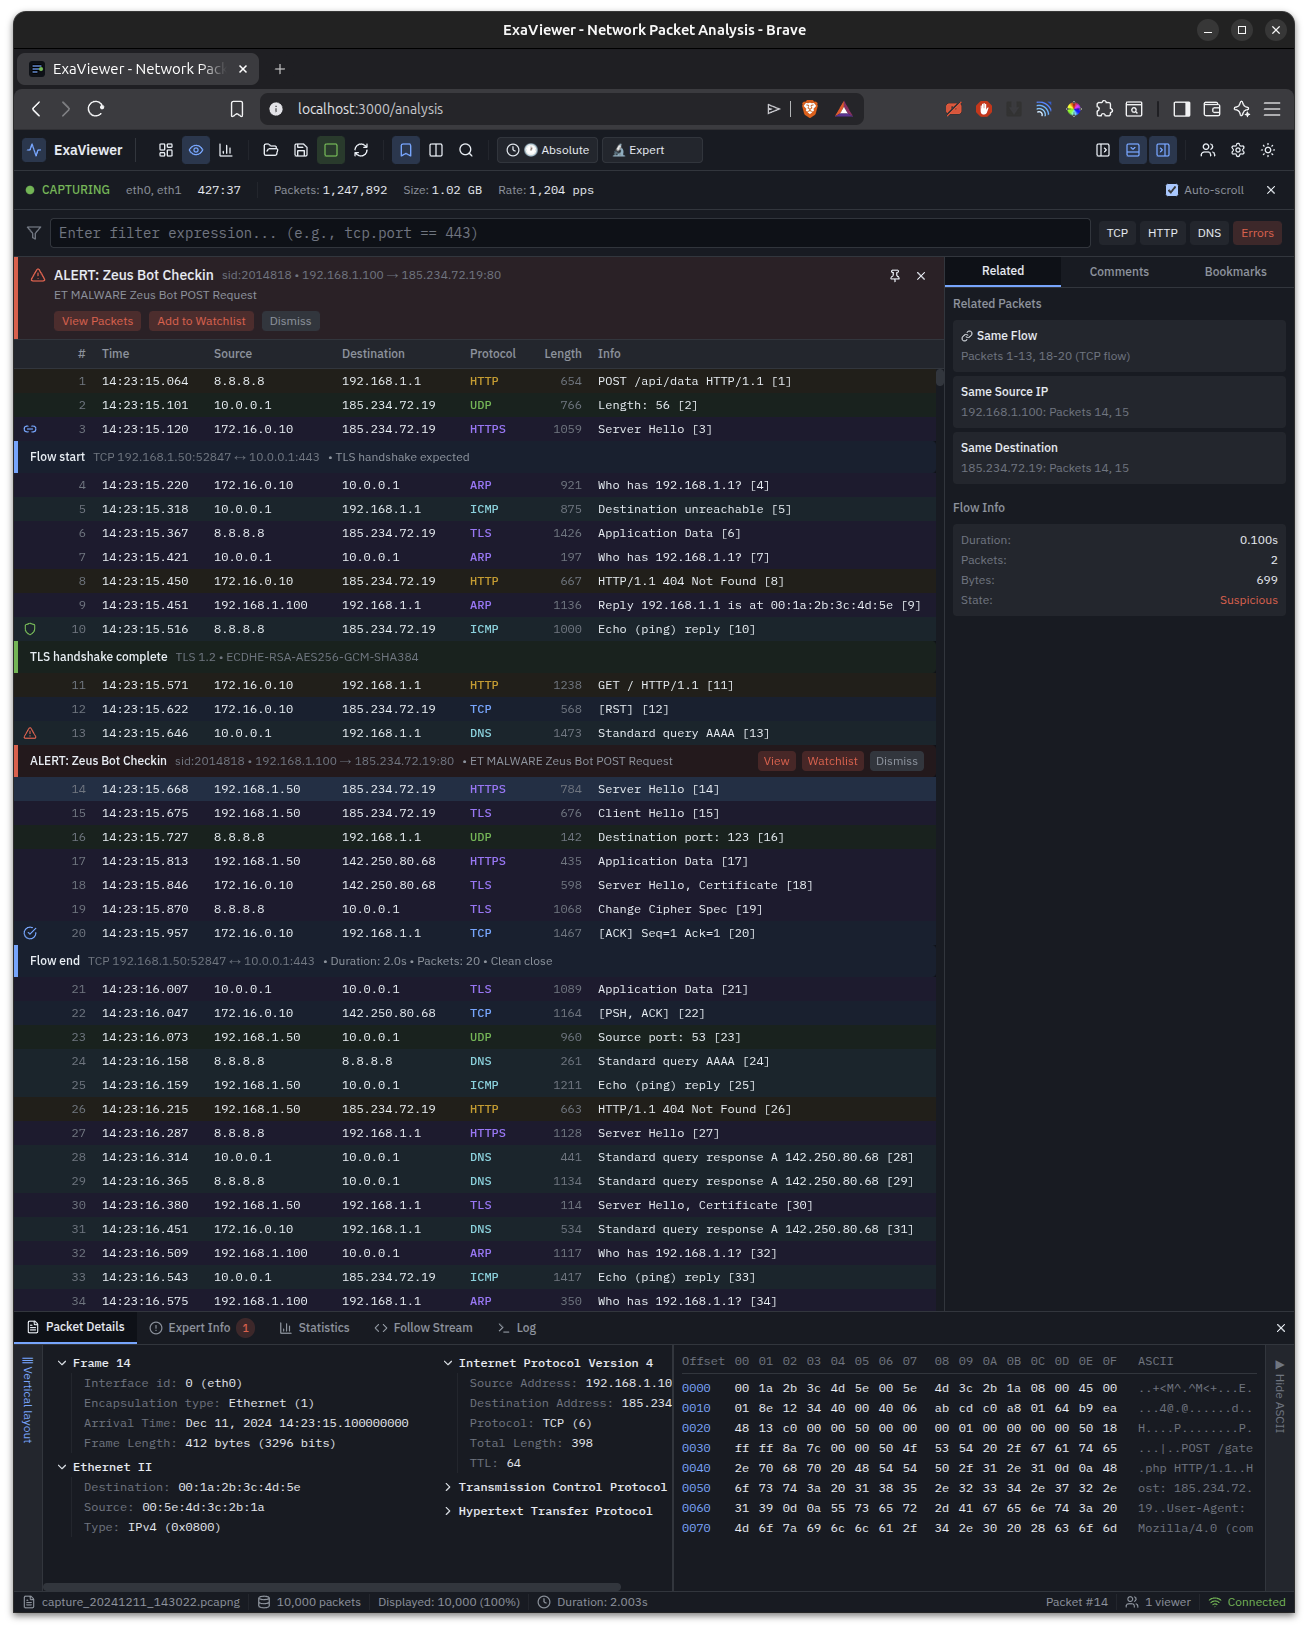
Packet analysis with inline IDS alerts, flow markers, bookmarks, and hex dump. Detecting Zeus Bot C2 communication in real-time.

ExaViewer dashboard showing capture infrastructure, performance metrics, discovered servers, and Suricata/Zeek integration

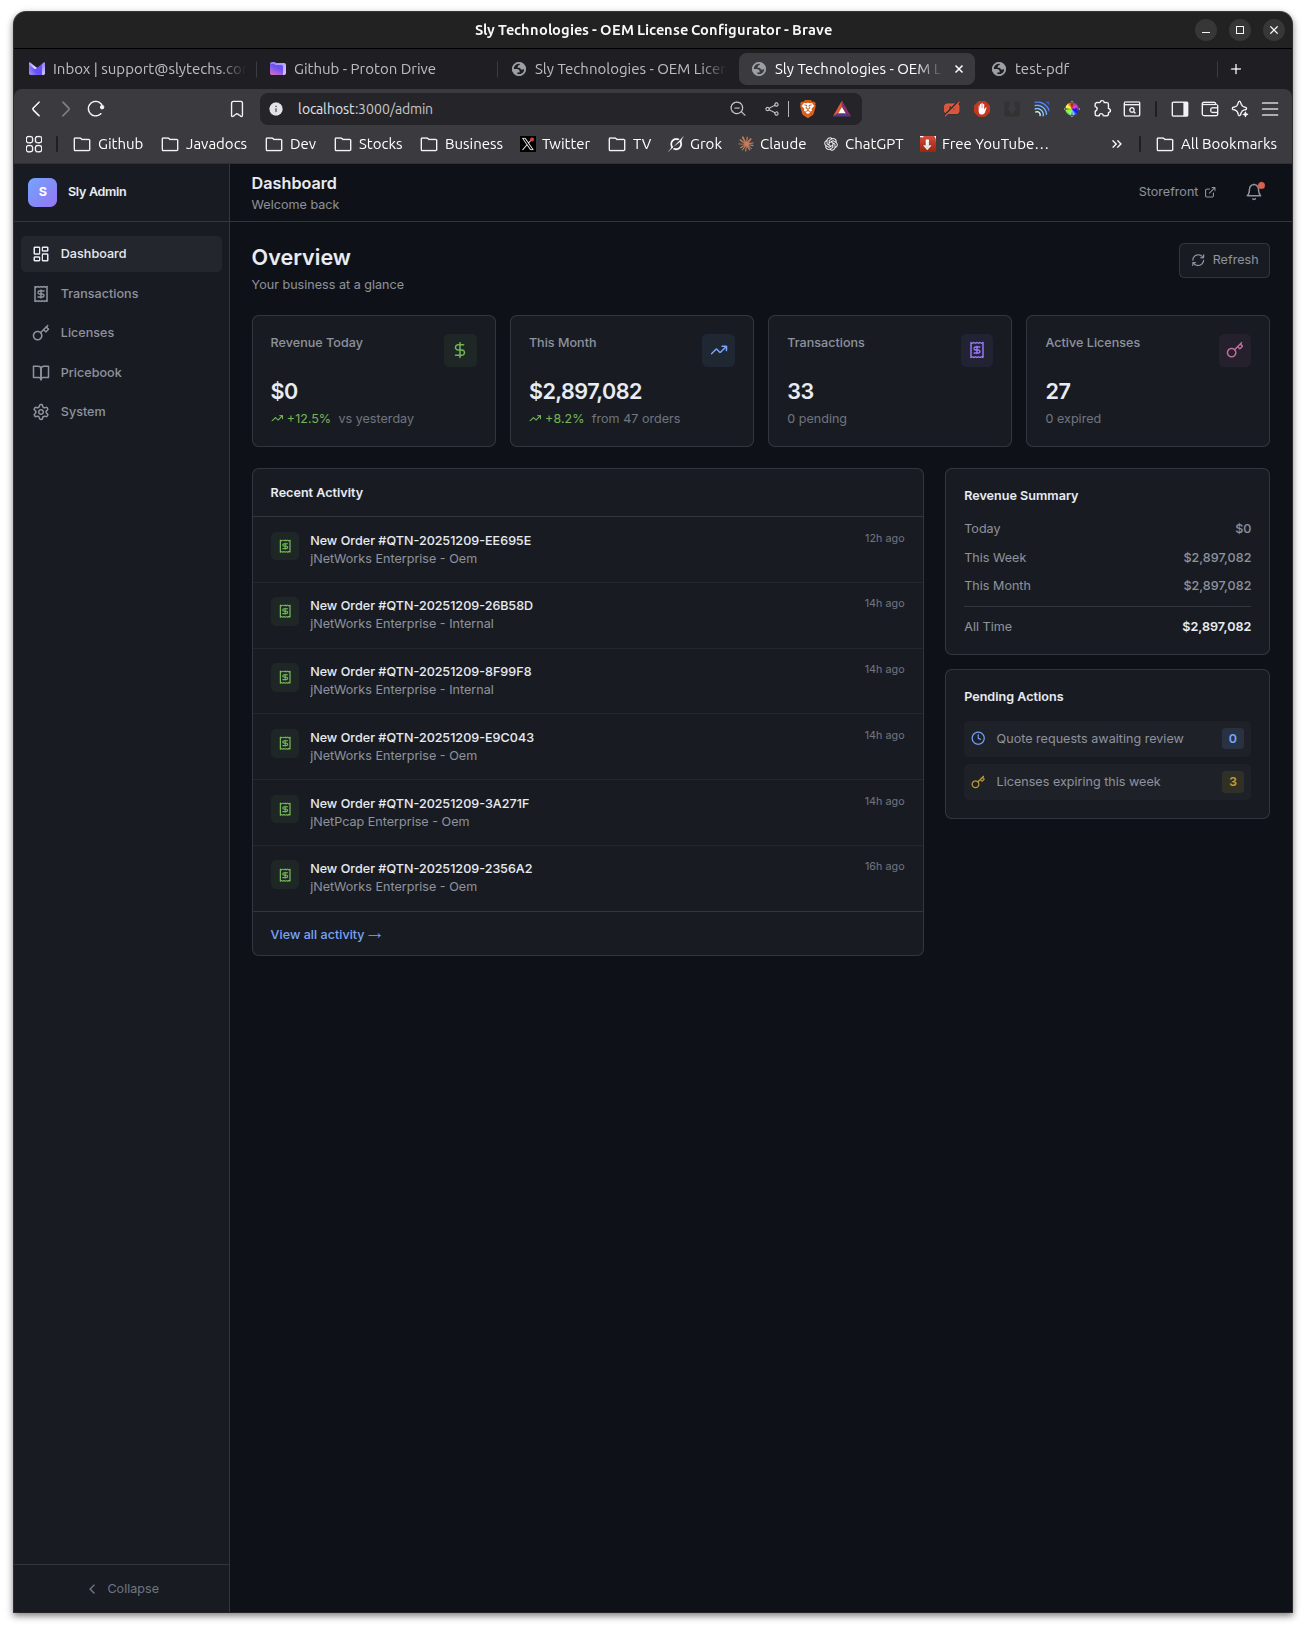
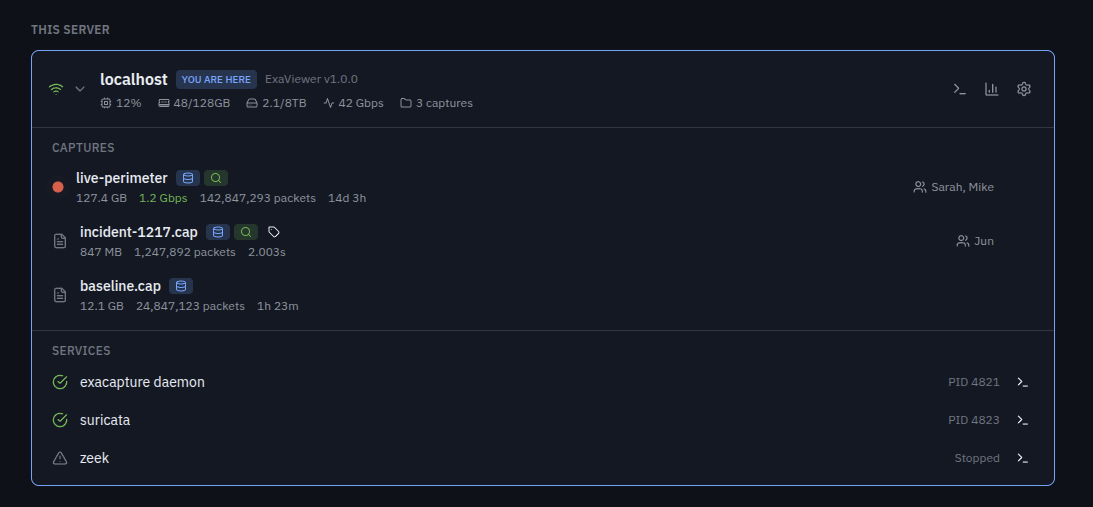
Fleet dashboard with server discovery, capture management, performance metrics, and integrated Suricata/Zeek services.

ExaViewer statistics view with real-time packet rate, bandwidth, CPU, memory charts, per-core usage, protocol distribution, and top talkers

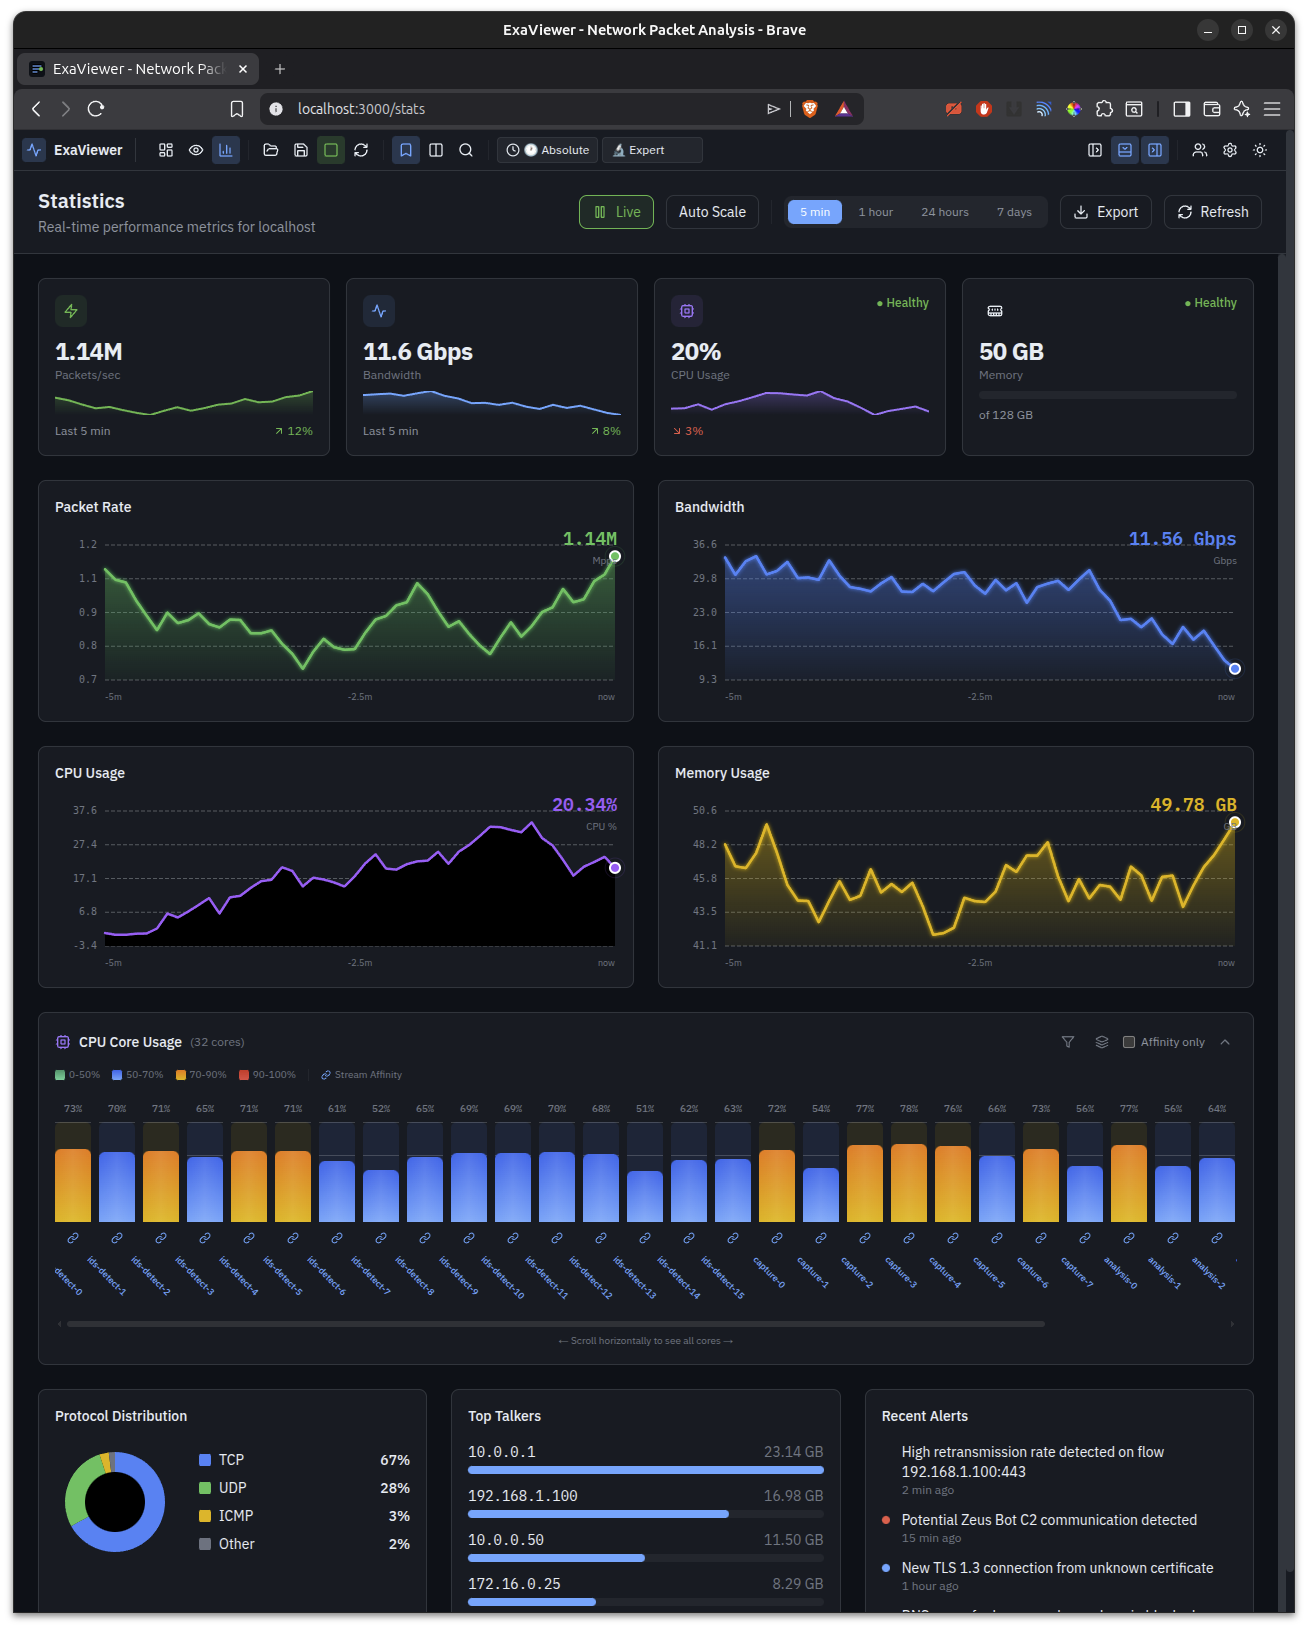
Live performance monitoring — packet rate, bandwidth, per-core CPU, protocol distribution, top talkers, and recent alerts.

Wireshark shows you packets.
ExaViewer shows you problems.

A Different Kind of Analysis

ExaViewer isn't a Wireshark clone. It's a fundamentally different approach to understanding network traffic.

Capability ExaViewer Wireshark CloudShark
Multi-petabyte files Native support RAM-limited Upload limited
Multi-user collaboration Real-time shared sessions Single user only Basic sharing
Security levels 0–20, field-level None None
Architecture Remote-first, data stays on server Local only Upload required
Live capture File-backed, unlimited Memory-limited Not supported
Problem detection Automatic, inline alerts Manual hunting Limited
Terminal interface Full TUI via SSH tshark (text only) None
ExaScale integration Same security model N/A N/A

Three Ways to Analyze

Web UI for the full experience. Terminal TUI for SSH access anywhere. CLI for scripting and automation. Same data, same security, same results.

ExaViewer web dashboard showing capture infrastructure with live-perimeter recording at 1.2 Gbps, Suricata and Zeek integration

Web Interface

Full-featured React UI running in any browser. Canvas-rendered packet list with virtual scrolling for millions of rows. Protocol tree, hex dump, inline IDS alerts with View/Watchlist/Dismiss actions, flow start/end markers, bookmarks, and real-time statistics. Manage your entire capture fleet from the dashboard.

ExaViewer terminal TUI showing packet analysis with protocol coloring, packet details tree, and hex dump

Terminal TUI — Analysis

Full packet analysis in your terminal. SSH into any capture server and analyze immediately. Protocol coloring, packet details, hex dump, filter expressions. F-key navigation between views.

ExaViewer terminal TUI chat showing multi-analyst collaboration with packet, flow, and alert references

Terminal TUI — Collaboration

Chat with fellow analysts in real-time. Reference specific packets, flows, and alerts inline with [P]acket ref, [F]low ref, and [A]lert ref. Collaborative investigation from any terminal.

Data Stays Where It Lives

Your laptop gets the pixels. The packets stay on the capture server. No downloading terabytes. No RAM limitations.

  ANALYST LAPTOP                        CAPTURE SERVER

  Browser or Terminal                    ExaViewer Daemon
  ┌─────────────────┐     HTTP/WS        ┌─────────────────────────┐
  │                 │     or SSH          │  Java Control Plane      │
  │  React UI       │◄───────────────────►│  ├─ Sessions            │
  │  Canvas packets │     pixels only     │  ├─ Auth & Security     │
  │  DOM panels     │                     │  └─ Multi-user sync     │
  │                 │                     │                         │
  └─────────────────┘                     │  jNetWorks Data Plane    │
        OR                                │  ├─ Packet capture      │
  ┌─────────────────┐                     │  ├─ Dissection L2-L7   │
  │  Terminal TUI   │                     │  ├─ Redaction engine    │
  │  (ncurses)      │◄──── SSH ──────────►│  └─ Binary encoding    │
  │  F-key nav      │                     │                         │
  └─────────────────┘                     │  Storage Layer           │
        OR                                │  ├─ ExaVolume (opt.)    │
  ┌─────────────────┐                     │  ├─ Plain PCAP files    │
  │  CLI pipe mode  │                     │  ├─ Indexes SIX/DIX    │
  │  exaviewer      │                     │  └─ Sidecars            │
  │   --dump | grep │                     └─────────────────────────┘
  └─────────────────┘

Built for Real Work

Inline IDS Alerts

Suricata and Zeek alerts appear directly in the packet list with View, Watchlist, and Dismiss actions. No context switching.

Flow Markers

Flow start, TLS handshake, and flow end markers inject automatically between packets. See the story of every connection.

Bookmarks & Annotations

Bookmark packets of interest with color-coded labels. Shared across all analysts viewing the same capture.

Virtual Scrolling

Canvas-rendered packet list handles millions of rows at 60 fps. No lag at any scale. Level-of-detail adaptive display.

Multiple Detail Levels

Expert mode shows raw protocol fields. Friendly mode explains what happened in plain English. Toggle per-packet or globally.

Fleet Management

Dashboard discovers ExaCapture servers on your network. See all captures, services, and performance from one place.

From Laptop to Air-Gapped Facility

Four deployment modes covering every scenario from development to classified environments.

90% of users

Standalone

Single user, local files

Open capture files on your own machine. No server needed. Security level 0 with no enforcement overhead. Full performance. Five-minute setup.

Enterprise

Networked

Multi-user with central vault

Multiple analysts, shared captures, central key management. Security levels 1–12. Audit logging. Connect to ExaCapture servers across your network.

Secure Remote

SSH Tunneled

Access isolated capture servers

Reach capture infrastructure through SSH tunnels. Authentication package-based security. Levels 1–17. Offline grace periods for intermittent connectivity.

Classified

Air-Gapped

No network connectivity

Physical authentication via USB or hardware token. Security levels 18–20. Two-person integrity controls. Designed for the most sensitive environments.

Scriptable. Pipeable. Automatable.

ExaViewer works in three modes: full web UI, terminal TUI, and CLI pipe mode. Every capability is accessible from the command line.

Connect to remote ExaCapture servers with SSH-style syntax. Pipe output to grep, custom scripts, or other tools in your workflow.

terminal
# Open local capture file
$ exaviewer /path/to/capture.pcapng

# Connect to remote ExaCapture server
$ exaviewer [email protected]:incident-1217

# Terminal TUI mode (ncurses)
$ exaviewer --terminal capture.cap

# Pipe mode for scripting
$ exaviewer --dump capture.cap | grep "POST /gate.php"
$ exaviewer --pipe capture.cap | ./detect-c2.sh

Ready to See Your Network Clearly?

Schedule a demo or download ExaViewer to get started.