ExaCapture v1.0

Capture at Scale.
24/7.

Enterprise capture daemon for persistent, high-volume packet recording at the network edge. Captures, indexes, and analyzes inline. Serves multiple analysts simultaneously. The packets never leave the server.

Vantage Console v1.0.0 (exacapture profile)
Copyright (c) 2025 Sly Technologies Inc.
Type 'help' for commands, Tab for completion, Ctrl-C to cancel

exa-capture@dco-server1> show status

  ExaCapture Daemon Status
  2026-02-27 13:12:50

    State         Running
    Uptime        14d 3h 22m
    PID           4821
    Version       ExaCapture v1.0.0
    Host          dco-server1

    Captures      3 (1 recording, 2 complete)
    Clients       2 connected
    Interfaces    eth0, eth1

    CPU           12%
    Memory        48 / 128 GB (37%)
    Disk          2.1 / 8.0 TB (26%)
    Net I/O       42 Gbps in, 1.2 Gbps out

exa-capture@dco-server1> discover
  Scanning...
   localhost:9800  ExaCapture v1.0.0
   lab-server.internal:9800  ExaCapture v1.0.0
   prod-tap-east.acme.com:9800  offline
  Found 2 servers (1 offline)

exa-capture@dco-server1> show sessions
  USER        LEVEL  ADDRESS       CONNECTED   VIEWING
  ─────────────────────────────────────────────────────────
  sarah       8      10.0.0.50     2h 14m      live-perimeter
  mike        5      10.0.0.51     45m         live-perimeter

exa-capture@dco-server1> show captures
  CAPTURE             STATE       SIZE       PACKETS        RATE       STARTED
  ────────────────────────────────────────────────────────────────────────────────
  live-perimeter      recording   127.4 GB   142,847,293    1.2 Gbps   Dec 20 08:00
  incident-1217.cap   complete    847 MB     1,247,892      -          Dec 17 02:14
  baseline.cap        complete    12.1 GB    24,847,123     -          Dec  1 00:00

exa-capture@dco-server1> help

  ExaQL Quick Reference

  Status & Info
    show status                     Daemon status overview
    show captures                   List all captures
    show capture <name>             Capture details
    show interfaces                 Network interfaces
    show stats                      Performance metrics
    show errors                     Error summary
    show sessions                   Connected users
    show servers                    Discovered servers
    show env                        Environment variables

  Data Queries
    show packets [where <filter>]   Query packets
    show flows [where <filter>]     Query flows
    show streams                    Active streams
    show feeds                      Data feeds

  Capture Control
    capture start <iface> [opts]    Start capture
    capture stop <name>             Stop capture
    capture pause <name>            Pause capture
    capture resume <name>           Resume capture

  Operations
    connect [<host>:<port>]         Connect to server
    disconnect                      Disconnect
    discover                        Scan for servers
    set <var>=<value>               Set variable
    history                         Command history
    clear                           Clear screen
    help                            This help
    quit                            Exit console

exa-capture@dco-server1> _
800 Gbps
Sustained Capture
0
Packets Dropped
24/7
Continuous Operation
0–20
Security Levels
ExaCapture manages captures.
ExaViewer views packets.

Clean separation. One captures and serves. The other analyzes and displays.

Not Just a Packet Recorder

ExaCapture captures, indexes, analyzes, and serves. For petabyte-scale captures, post-hoc analysis isn't practical. The analysis must happen during capture.

Captures at Scale

Sustained high-rate capture without packet loss. Built on jNetWorks with DPDK kernel-bypass and Napatech SmartNIC support. Line-rate on every port.

Indexes Everything

As packets arrive, ExaCapture builds flow tables, protocol statistics, and timestamp indexes. When you need to find something, you query — you don't scan.

Analyzes Inline

Protocol dissection, analysis token generation, anomaly detection, and IDS integration — all at capture time. You can't re-analyze a year of traffic after the fact.

Deferred Analysis

Capture at maximum throughput with minimal processing, then run analysis passes during off-peak hours. Capture files track what processing has been applied.

Security Enforcement

Every capture session enforces security levels 0–20. Different analysts see different views of the same data based on clearance. Obfuscation happens at the source.

Serves Multiple Clients

ExaCapture is a daemon. It runs continuously and serves packet data to any authorized ExaViewer client. Five analysts viewing the same live capture simultaneously.

Analysis Tokens: Analyze Once, Render Many Times

ExaCapture generates analysis tokens inline with packet capture — flow boundaries, protocol events, IDS alerts, anomaly markers. These tokens are stored alongside the raw packets.

When ExaViewer connects, it reads existing tokens rather than re-analyzing. For small captures, this is a convenience. For petabyte-scale captures, it's essential.

Capture files track what processing has been applied — indexed, analyzed, tagged — so analysts always know what they're working with.

analysis tokens
-- Raw packets with inline tokens

Packet 1  10.0.0.1 → 8.8.8.8  DNS
Packet 2  10.0.0.1 → 185.234.72.19  TCP SYN

[Token: Flow Start tcp:10.0.0.1:443]

Packet 3  185.234.72.19 → 10.0.0.1  SYN-ACK
Packet 4  10.0.0.1 → 185.234.72.19  ACK

[Token: TLS Handshake Complete]
[Token: ECDHE-RSA-AES256-GCM-SHA384]

Packet 5  10.0.0.1 → 185.234.72.19  POST

[Token: Alert sid:2014818]
[Token: ET MALWARE Zeus Bot POST]

-- ExaViewer renders tokens instantly
-- No re-analysis needed

Three Ways to Manage

Console for scripting and automation. Terminal for constrained environments. Web dashboard for visual management. Same capabilities, different access patterns.

exacapture console
exa-capture@dco-server1> show status

  ExaCapture Daemon Status
    State         Running
    Uptime        14d 3h 22m
    Captures      3 (1 recording, 2 complete)
    Clients       2 connected

exa-capture@dco-server1> show captures
  CAPTURE             STATE       SIZE       PACKETS        RATE
  ──────────────────────────────────────────────────────────────────
  live-perimeter      recording   127.4 GB   142,847,293    1.2 Gbps
  incident-1217.cap   complete    847 MB     1,247,892      -
  baseline.cap        complete    12.1 GB    24,847,123     -

exa-capture@dco-server1> show sessions
  USER        LEVEL  ADDRESS       CONNECTED   VIEWING
  ─────────────────────────────────────────────────────────
  sarah       8      10.0.0.50     2h 14m      live-perimeter
  mike        5      10.0.0.51     45m         live-perimeter

exa-capture@dco-server1> _

Console (CLI)

Full command-line interface for scripting and automation. Show status, discover servers, manage captures and sessions, configure retention policies. SSH in from anywhere. Pipe output to monitoring systems.
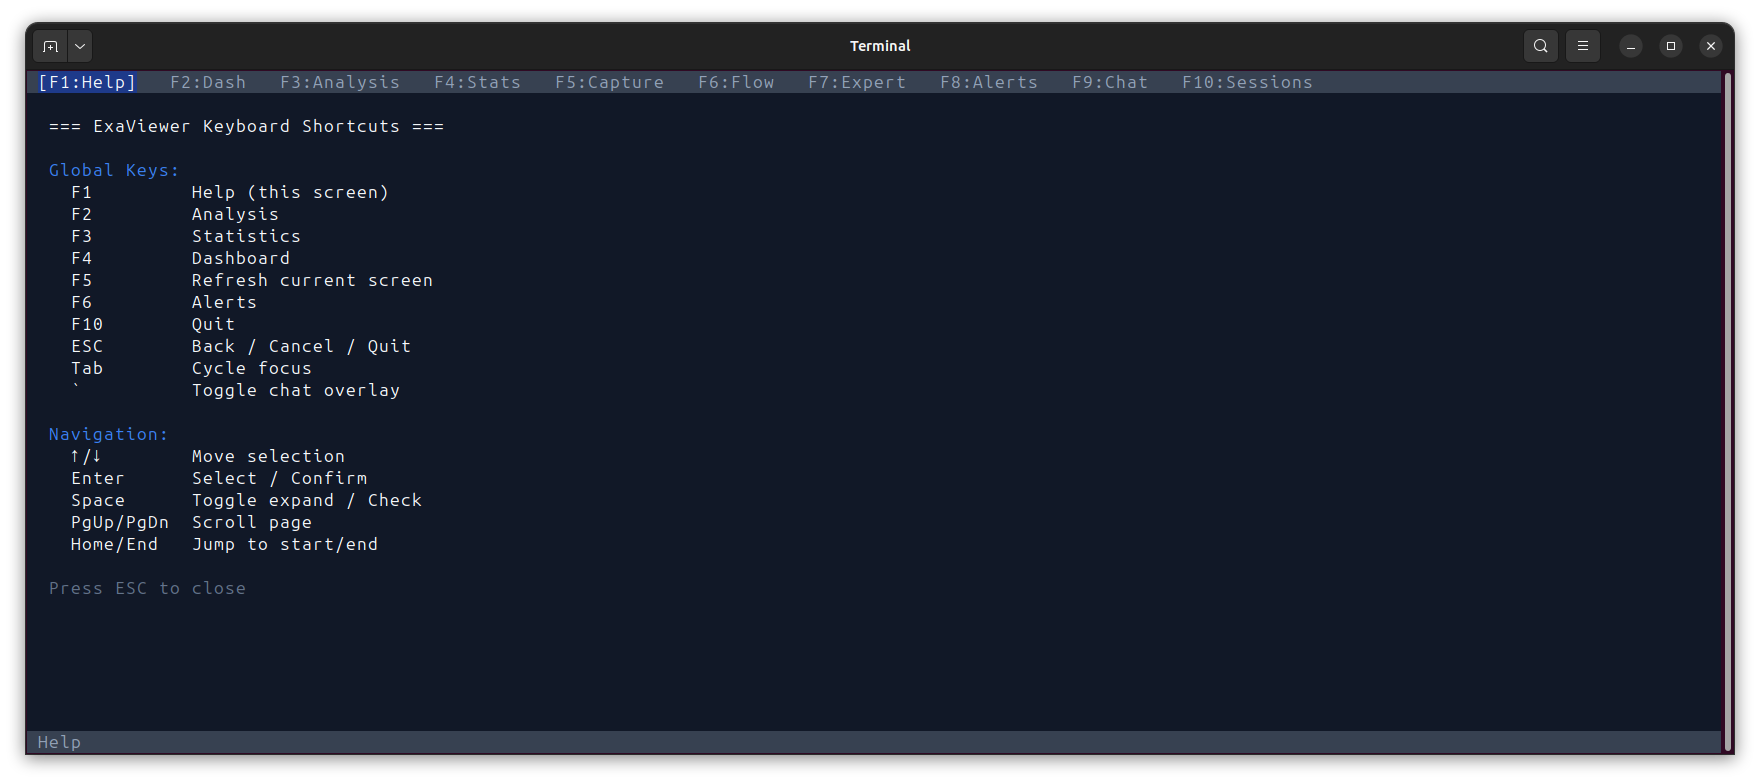
ExaCapture terminal TUI with F-key navigation showing dashboard, stats, capture management, and alerts views

Terminal (ncurses)

Visual TUI for slow connections or constrained environments. F-key navigation between views. Live updating statistics, capture status, and alert feeds. All management capabilities accessible without a browser.
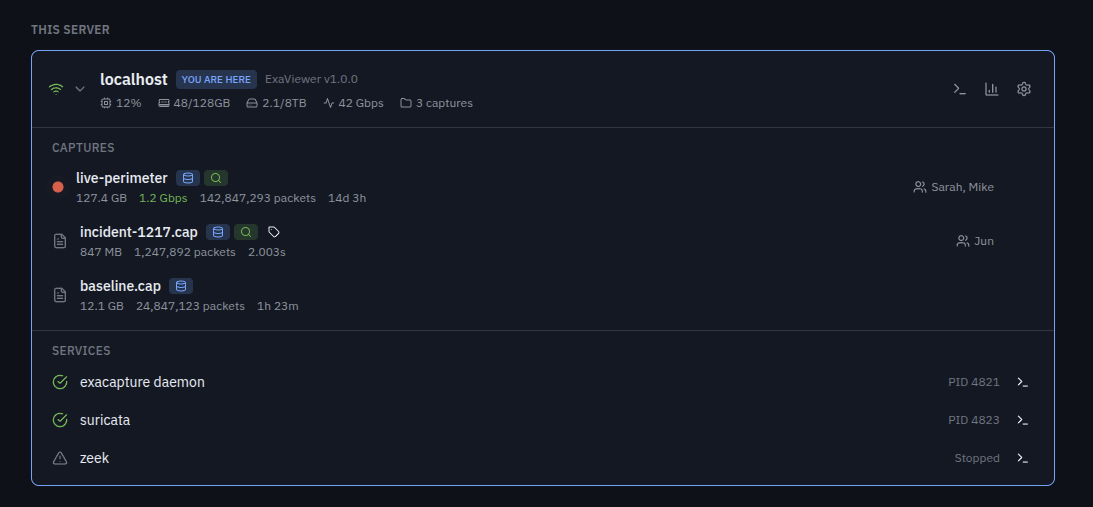
ExaCapture web dashboard showing server status, active captures with badges, and integrated Suricata and Zeek services

Web Dashboard

React-based management interface. Server status, capture management, performance metrics, connected clients, and service integration. Connect via browser directly or through SSH tunnel. Shows status — not packets.

Better Together

ExaCapture and ExaViewer share the same dashboard, the same discovery protocol, the same security model. Two products, one architecture.

  THE WORKFLOW THAT ACTUALLY WORKS

  It's 2am. Incident response.
  Capture is on a server in a datacenter.
  Your team is in three time zones.

  Old way:
  Download 50 GB. Wait. Upload to cloud.
  Wait. Everyone downloads. Someone's VPN
  breaks. An hour gone before anyone sees
  packets together.

  New way:
  $ exaviewer mark@dco-server1:incident-1217

  You're in. Packets streaming.
  Sarah in London joins. Mike in Austin.
  Same data. Same view. Real-time.

  No downloads. No uploads. No cloud.
  The packets never leave the server.

Unified Resource Management

Open either product. You see the same dashboard. The same discovered servers. The same captures with processing badges showing what's been indexed, analyzed, and tagged.

In ExaCapture, clicking a capture shows management options — permissions, retention, processing status. In ExaViewer, clicking the same capture opens the analysis view with full packet data.

Same dashboard. Same resource visibility. Different capabilities based on context.

Discovery

Both products discover each other automatically. Localhost is always checked with zero configuration. LAN multicast probe for trusted networks. Manual server list for WAN, VPN, or cloud deployments. Your entire capture infrastructure visible from one place.

Security at the Source

Obfuscation happens at ExaCapture before data is transmitted. You can't see what you're not cleared for. Period.

Analyst Security Level What They See
Senior Analyst Level 5 Full packet data, all payloads, all metadata
Junior Analyst Level 3 Packets with payload content obfuscated
External Consultant Level 1 Metadata only — protocols, timing, sizes

20 Configurable Levels

Granular security from Level 0 (no enforcement, standalone use) through Level 20 (air-gapped, two-person integrity, hardware tokens).

PII Obfuscation

Automatic detection and obfuscation of PII, IMSI, IMEI, credit card numbers, and other sensitive data. Policy-driven, not manual.

Encryption at Rest

AES-256-GCM encryption for stored captures. Policy-driven key management. Captures are protected from the moment they hit disk.

Native IDS Integration

ExaCapture integrates with Suricata and Zeek natively. IDS alerts are captured as analysis tokens alongside packets, so when an analyst opens a capture in ExaViewer, alerts appear inline in the packet list with full context.

No separate tools. No context switching. No correlating timestamps across different log files. The alert is right there, next to the packet that triggered it.

Suricata rule compatibility means your existing rulesets work immediately. Zeek logs are ingested as structured metadata.

services
> services
SERVICE              STATE     PID
exacapture daemon    running   4821
suricata             running   4823
zeek                 stopped   -

> suricata status
Rules loaded: 48,293
Alerts (24h): 127
Last alert: 3m ago
  sid:2014818 ET MALWARE Zeus Bot POST
  10.0.0.1:49152 → 185.234.72.19:80

> suricata rules reload
Reloading Suricata rules...
Rules loaded: 48,307 (+14 new)

> _
deployment
# Install
$ apt install exacapture

# Start as daemon (systemd)
$ systemctl enable exacapture
$ systemctl start exacapture

# Or start manually
$ exacapture start \
    --interface eth0,eth1 \
    --output /captures/ \
    --retention 90d \
    --security-level 5

# Check status
$ exacapture status
ExaCapture v1.0.0 - running
Uptime: 14d 3h 22m
Captures: 3 | Clients: 2
Disk: 2.1/8 TB (26%)

# Enter interactive console
$ exacapture console

Five-Minute Setup

Install the package. Start the daemon. ExaCapture runs as a systemd service with automatic restart, log rotation, and health monitoring.

Configuration via YAML config file or command-line arguments. Prometheus metrics endpoint for integration with your existing monitoring infrastructure.

Deploy on your datacenter tap. Your cloud gateway. Your SOC sensor. ExaCapture runs continuously without human intervention. When something happens, the data is already there.

Start Here. Scale Forever.

  ExaViewer               ExaCapture
  View and analyze          Capture and index
  Perpetual license         Subscription per server
        │                         │
        └────────────┬────────────┘
        │
        Same dashboard
        Same discovery
        Same security model
        Same analysis tokens
        │
        ▼
         Vantage Platform (2026)
         Federate and scale
         Exabyte-scale capture
        Global cluster management

Start with ExaViewer and local files. Add ExaCapture when you need persistent infrastructure. Scale to Vantage Platform when you're managing petabytes across continents.

Ready to Capture at Scale?

Schedule a demo or talk to our team about deployment.